Keycloak Performance Benchmarks: A Deep Dive into Scaling and Sizing (26.4)
October 01 2025 by Pedro Ruivo
When deploying a mission-critical component like Keycloak, performance is a top concern. Questions about resource requirements, high availability, and network latency are crucial for a successful and stable production environment. To provide a clear, data-driven perspective on these topics, we conducted a series of benchmarks on the latest Keycloak version 26.4. In this post, we’ll share our findings on how Keycloak scales with increasing load, performs under artificial network latency, and leverages caching to optimize database usage.
Share your feedback about this blog post in our forum!
Environment
-
OpenShift 4.17 deployed across three availability zones in
eu-west-1.-
Provisioned using Red Hat OpenShift Service on AWS (ROSA), with ROSA HCP.
-
At least one worker node in each availability zone.
-
-
Amazon Aurora PostgreSQL 17.5 database.
-
Configured for high availability, with a primary DB instance in one availability zone and synchronously replicated readers in the other availability zones.
-
Database populated with 100,000 users.
-
-
Keycloak Benchmark as the load generator.
-
The benchmark ran on 20 to 50
t4g.smallAWS instances in the same region.
-
Scaling Keycloak
One of the most common questions when deploying Keycloak is: how many resources do I need? The answer, as you may have guessed, is that it depends on your specific use case.
For this test, we scaled only the login and refresh token requests. Based on Keycloak’s Concepts for sizing CPU and memory resources documentation, we determined that you need 1 vCPU to handle 15 logins per second and an additional 1 vCPU to handle 120 refresh token requests per second.
After computing the total number of vCPUs required, we divided the value by the desired number of Pods, which was three in this case (one for each availability zone). We allocated slightly more vCPU to each Pod than the calculated value to account for JVM background tasks like compilations and garbage collection.
|
Because our test used a constant load, we did not allocate as much CPU as we typically recommend. We strongly recommend leaving 150% extra headroom for CPU usage to handle spikes in load, as mentioned in our documentation. |
Memory was increased when we observed high CPU usage by the garbage collector (GC). It is difficult to formulate a precise memory requirement because it depends not only on the Keycloak data but also on the number of concurrent requests.
The database instance type was chosen based on observation. If we observed failing requests or a 99th percentile response time above 100ms with database CPU usage exceeding 80%, we repeated the test using the next larger database instance type.
A summary of the results can be observed in the table below.
| OCP Instance Type | DB Instance Type | Pod CPU limit | Pod Memory Limit (GB) | # Pods | Logins/sec | Token Refreshes/sec |
|---|---|---|---|---|---|---|
|
|
24 |
4 |
3 |
500 |
2500 |
|
|
40 |
8 |
3 |
1000 |
5000 |
|
|
74 |
8 |
3 |
2000 |
10000 |
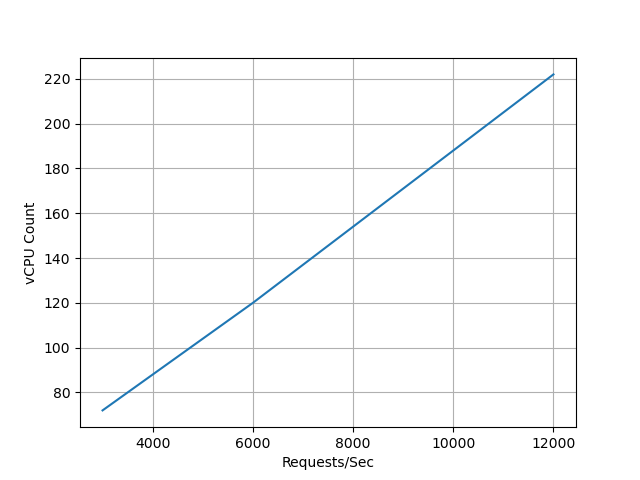
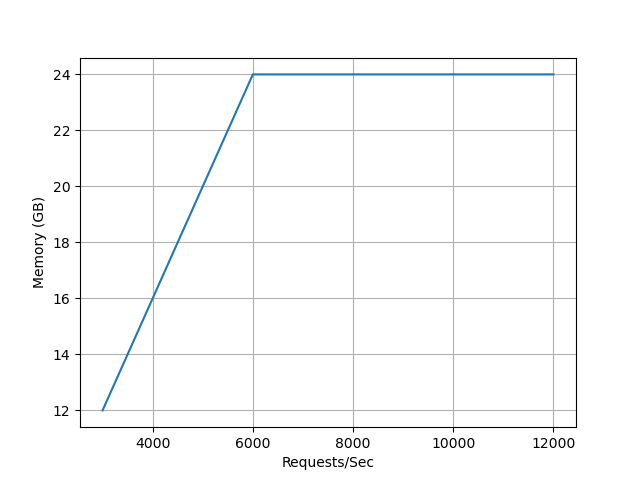
Based on the overall results, we can confirm that Keycloak scales vertically almost linearly in the tested range.
Except the last test, we used the default Keycloak configuration.
For the final test, we had to increase the number of threads (using the http-pool-max-threads option) to 330 for the scenario with the 2,000 logins and 10,000 token refreshes.
We scaled up the OpenShift Ingress Routers because we were observing connection errors on the load generator.
The following images illustrate how the requests correlated with the configured CPU and memory limits.
Latency
Now that we have an understanding of the resources needed, our focus shifts to achieving high availability. A key aspect of this is deploying Keycloak across different availability zones, which, by its nature, introduces additional latency between Keycloak’s Pods. This leads us to a crucial question: how does Keycloak behave under these conditions?
To find out, we used Chaos Mesh to introduce an artificial delay to all outgoing network packets.
The table below specifies the round-trip delay increase, corresponding to the first column.
Since Keycloak 26.4 includes performance improvements for high availability deployments across different availability zones, we compare the results with the previous release, Keycloak 26.3.5.
For Keycloak 26.3, we set spi-user-sessions—infinispan—use-batches to false to achieve a better response time (this option is disabled by default in Keycloak 26.4).
For this test, we used the 500 logins/second and 2,500 token refreshes/second setup. The table below summarizes the gathered data, where the 99th percentile of the response time is taken from the Gatling report.
| Round-Trip Delay (ms) | Keycloak 26.3 | Keycloak 26.4 |
|---|---|---|
0 |
51 |
47 |
10 |
116 |
84 |
20 |
1076 |
130 |
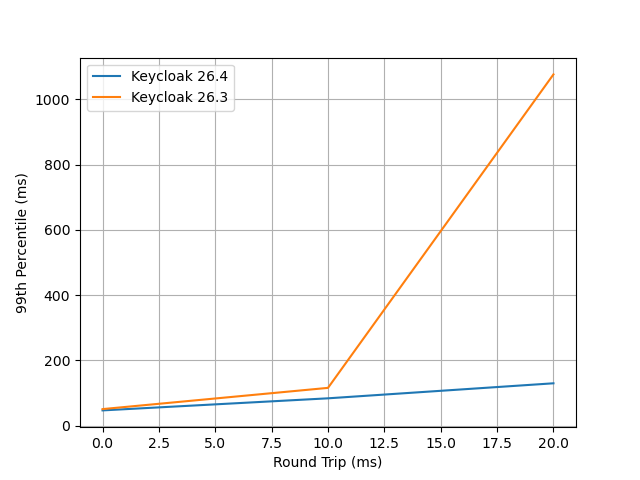
As anticipated, Keycloak’s performance degrades under high-latency network conditions. Round-trip delays of 10ms already push response times into the three-digit millisecond range.
For multi-availability zone deployments, Keycloak performs well because most cloud providers offer very low latency networks within the same region. However, we do not recommend deploying Keycloak across different regions as the increased latency and potential for network instability can significantly degrade performance and reliability.
A visual representation of these results can be found below.
Caching
Finally, let’s look at the impact of caching.
Have you ever wondered how large your Keycloak cache should be? While we don’t have a clear answer on that, we can tell you that increasing the cache size did not lead to any visible improvements in request response times during our tests.
However, it had a significant impact on something that is not directly visible to users: the Aurora Database peak CPU usage. The table below illustrates how the database’s peak CPU usage changed as we varied the Keycloak cache size.
For this benchmark, we used the 500 logins/second and 2,500 token refreshes/second setup.
| Cache Size | Aurora CPU usage (%, peak) |
|---|---|
10000 |
77.77 |
20000 |
76.92 |
50000 |
75.13 |
100000 |
66.12 |
200000 |
63.77 |
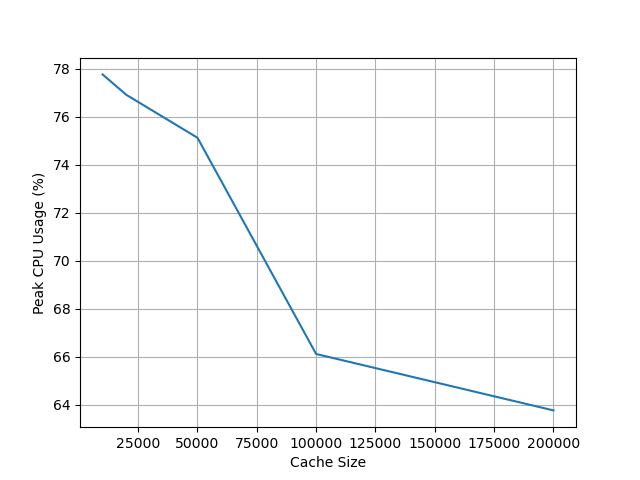
Our tests show that increasing the Keycloak cache size significantly reduces the Aurora Database’s peak CPU usage, which dropped from 77% to 63%.
While this change had a minimal impact on overall memory usage, increasing it from 1.30 GB to 1.45 GB, we did observe an expected rise in average Garbage Collection (GC) pauses, from 3.99ms to 4.91ms. Both of these behaviors are expected, as a larger cache naturally requires more memory, leading to slightly longer GC pauses.
A visual representation of these results can be found in the chart below.
To monitor the number of entries in the caches and how often entries are evicted to make space for new entries, see our metrics guide for embedded caches. This information is also visualized in our Grafana dashboard.
Conclusion
Our benchmark results confirm that Keycloak is a robust and highly scalable identity and access management solution. We have shown that with careful planning and proper resource allocation, Keycloak can handle significant loads while scaling almost linearly to 12,000 requests per second.
The data also underscores the importance of a low-latency network for multi-zone deployments and the significant role of caching in reducing database strain. By taking these factors into account, you can deploy and operate Keycloak with more confidence.
The tools and scripts we used for this are available in the Keycloak Benchmark GitHub repository, so you can use them to test your specific loads in your own environment.
Share your feedback about this blog post in our forum!