bin/kc.[sh|bat] start --telemetry-endpoint=http://my-otel-endpoint:4317Nightly release
This guide is for the unstable nightly release, for the latest release go here.Centralize your observability stack with OpenTelemetry
Learn about OpenTelemetry integration for centralized observability and telemetry data.OpenTelemetry (OTel) is an open-source observability framework designed to provide consistent and reliable ways to collect telemetry data across distributed systems. It is a project under the Cloud Native Computing Foundation (CNCF) as an incubating project. Its goal is to provide a unified standard and toolset for instrumenting, generating, and exporting telemetry data from modern applications, making it easier to monitor, debug, and understand complex services.
The goal of Keycloak is to support OpenTelemetry Logs, Metrics, and Traces to create a centralized observability stack without any additional deployment overhead.
General options
Keycloak provides support for global settings of telemetry data export. It means that you can configure connection parameters to a single OpenTelemetry collector that will be used for all supported components.
In order to have OpenTelemetry enabled, at least one component needs to be turned on, for example Traces.
| The OpenTelemetry feature is enabled by default. Disable the feature in order to disable OpenTelemetry components. |
Endpoint
You can configure the OpenTelemetry collector’s global endpoint that is shared across all components by using the telemetry-endpoint option.
The default value is http://localhost:4317.
You can change the endpoint via CLI as follows:
Service name
You can configure the global OpenTelemetry service name used for identifying the exporter of the telemetry data.
The default service name is keycloak, specified via the telemetry-service-name property, which takes precedence over service.name defined in the telemetry-resource-attributes property.
You can change the service name via CLI as follows:
bin/kc.[sh|bat] start --telemetry-service-name=my-keycloak-iamProtocol
You can configure the global OpenTelemetry transport protocol used as a communication channel between Keycloak and the OpenTelemetry collector.
The default value is grpc.
Keycloak supports these communication protocols:
-
grpc(default) -
http/protobuf
You can change the protocol via CLI as follows:
bin/kc.[sh|bat] start --telemetry-protocol=http/protobufRequest headers
You can configure custom request headers that will be sent when exporting telemetry data to the OpenTelemetry collector. This is useful for providing authentication tokens or other custom headers required by your telemetry backend.
Use the telemetry-header-<header> option to set headers for all telemetry components (logs, metrics, and traces).
Replace <header> with your custom header name in the option name.
bin/kc.[sh|bat] start --telemetry-header-Authorization='Bearer my-token' --telemetry-header-X-Custom-Header=custom-value| Component-specific headers take precedence over general headers for their respective components. |
Configuration via Keycloak CR (Operator)
The Keycloak CR has first-class citizen configuration options for telemetry. These may be configured under the spec.telemtry stanza as follows:
apiVersion: k8s.keycloak.org/v2beta1
kind: Keycloak
metadata:
  name: example-kc
spec:
  telemetry:
    endpoint: http://my-telemetry:4317          # default 'http://localhost:4317'
    serviceName: my-best-keycloak-telemetry     # default 'keycloak'
    protocol: http/protobuf                     # default 'grpc'
    resourceAttributes:
      service.namespace: keycloak-namespace-telemetry
These fields should reflect a 1:1 association with telemetry-* server options.
Enable all OpenTelemetry components
To enable OpenTelemetry metrics, logs, and traces, you can configure the Keycloak CR as follows:
| OpenTelemetry Logs and Metrics are preview/experimental features. |
apiVersion: k8s.keycloak.org/v2alpha1
kind: Keycloak
metadata:
  name: example-kc
spec:
  features:
    enabled:
      - opentelemetry-logs
      - opentelemetry-metrics
  telemetry:
    endpoint: http://my-telemetry:4317
    serviceName: my-best-keycloak-telemetry
    protocol: grpc
  tracing:
    enabled: true
  additionalOptions:
    - name: telemetry-logs-enabled
      value: "true"
    - name: telemetry-metrics-enabled
      value: "true"
    - name: metrics-enabled
      value: "true"
Traces
You can override the global OpenTelemetry settings via the Tracing options if you want to export traces to a different OpenTelemetry collector.
Logs
|
OpenTelemetry Logs support is Preview and is not fully supported. This feature is disabled by default. To enable start the server with |
The OpenTelemetry feature (opentelemetry) needs to be turned on (by default).
|
It is possible to export Keycloak’s logs to the OpenTelemetry collector and be managed by various logging backends that support OpenTelemetry.
Enable Logs
You can enable OpenTelemetry Logs via CLI as follows:
bin/kc.[sh|bat] start --features=opentelemetry-logs --telemetry-logs-enabled=trueFor more information on how to set up logging, see the Configuring Logging guide.
Log level
By default, all log levels are exported by Keycloak.
You can optionally configure the most verbose log level to be exported via the telemetry-logs-level option.
The telemetry-logs-level option filters which logs are exported to OpenTelemetry, while log-level and log-level-<category> control which logs Keycloak generates.
The telemetry filter is applied to already-generated logs, so setting telemetry-logs-level=DEBUG will not export DEBUG logs if log-level=WARN.
For example, if you want only to export WARN and ERROR logs, you can change the log level via the CLI as follows:
bin/kc.[sh|bat] start --telemetry-logs-level=WARNMetrics
| The OpenTelemetry Metrics feature is currently experimental, and it is not recommended for use in production. |
In order for the Metrics feature to function, the OpenTelemetry feature opentelemetry cannot be disabled.
|
For integrating OpenTelemetry Metrics, Keycloak uses the Micrometer-to-OpenTelemetry bridge, which provides the functionality to export metrics created by Micrometer to the OpenTelemetry Collector. This means that all metrics created via Micrometer or OpenTelemetry metrics will be exported to the OpenTelemetry.
There are some API, and Semantic convention differences for Micrometer vs OTel Metrics, so you should check if all required metrics are exported.
Enable Metrics
You can enable the OpenTelemetry Metrics via CLI as follows:
bin/kc.[sh|bat] start --features=opentelemetry-metrics --telemetry-metrics-enabled=true --metrics-enabled=true
Metrics (metrics-enabled) needs to be enabled as well
|
For more information on how to set up metrics, see the configuration options below or visit the Gaining insights with metrics guide.
Development setup
For development purposes, you can use the Grafana OTel-LGTM service, containing OpenTelemetry Collector and backends for logs (Loki), metrics (Prometheus), and traces (Tempo).
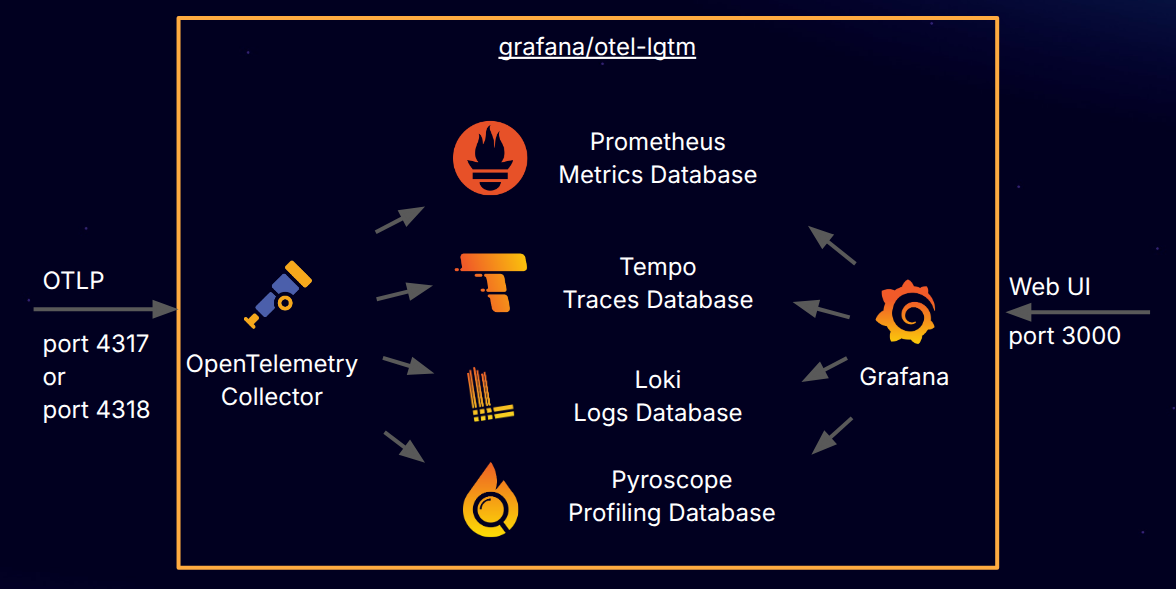
Figure 1. Service architecture
You can start the service by using Docker/Podman as follows:
docker run -p 3000:3000 -p 4317:4317 -p 4318:4318 --rm -ti grafana/otel-lgtmThen, you can navigate to Grafana UI by accessing localhost:3000 and then you can explore all the data sent to OpenTelemetry Collector.
Relevant options
| Type or Values | Default | |
|---|---|---|
Available only when any of available OpenTelemetry components (Logs, Metrics, Traces) is turned on |
String |
|
Available only when any of available OpenTelemetry components (Logs, Metrics, Traces) is turned on |
String |
|
Available only when any of available OpenTelemetry components (Logs, Metrics, Traces) is turned on |
|
|
Available only when any of available OpenTelemetry components (Logs, Metrics, Traces) is turned on |
List |
|
Available only when any of available OpenTelemetry components (Logs, Metrics, Traces) is turned on |
String |
|
Traces
| Type or Values | Default | |
|---|---|---|
Available only when 'opentelemetry' feature is enabled |
|
|
Available only when Tracing is enabled |
String |
|
Available only when Tracing is enabled |
|
|
Available only when Tracing is enabled DEPRECATED.
Resource attributes are not directly related to Tracing and you should use the Telemetry option which takes precedence. Use: |
List |
|
Available only when Tracing is enabled DEPRECATED.
Service name is not directly related to Tracing and you should use the Telemetry option which takes precedence. Use: |
String |
|
Logs
| Type or Values | Default | |
|---|---|---|
Available only when feature 'opentelemetry-logs:v1' is enabled |
|
|
Available only when Telemetry Logs functionality ('telemetry-logs-enabled') is enabled |
String |
|
Available only when Telemetry Logs functionality ('telemetry-logs-enabled') is enabled |
String |
|
Available only when Telemetry Logs functionality ('telemetry-logs-enabled') is enabled |
|
|
Available only when Telemetry Logs functionality ('telemetry-logs-enabled') is enabled |
|
Metrics
| Type or Values | Default | |
|---|---|---|
|
|
|
Available only when metrics and feature 'opentelemetry-metrics:v1' are enabled |
|
|
Available only when metrics ('metrics-enabled') and Telemetry Metrics functionality ('telemetry-metrics-enabled') are enabled |
String |
|
Available only when metrics ('metrics-enabled') and Telemetry Metrics functionality ('telemetry-metrics-enabled') are enabled |
String |
|
Available only when metrics ('metrics-enabled') and Telemetry Metrics functionality ('telemetry-metrics-enabled') are enabled |
String |
|
Available only when metrics ('metrics-enabled') and Telemetry Metrics functionality ('telemetry-metrics-enabled') are enabled |
|
On this page