Tracing and additional metrics with OpenTelemetry

Collect traces and additional metrics using OpenTelemetry during development and performance runs.

About OpenTelemetry

OpenTelemetry provides high-quality, ubiquitous, and portable telemetry to enable effective observability.

This project uses it to collect metrics and traces from Keycloak:

  • The traces allow insights into Keycloak and break down a request into a tree of internal and database calls.

  • The metrics allow durations and response code statistics for each endpoint of Keycloak.

Visit the OpenTelemetry website for more information about the tool, and the sections below on how to access and use this information.

Setting up OpenTelemetry

OpenTelemetry is disabled by default. It needs to be enabled via the customizing the setting KC_OTEL.

Depending on the setting KC_OTEL_SAMPLING_PERCENTAGE, only a percentage of traces might be recorded for performance reasons.

The setup is included in this project’s Keycloak helm chart, which includes the following:

  1. Download the OpenTelemetry Java agent using an init container to a persistent volume to cache it between runs.

  2. Add the agent to the Java options, so it instruments Keycloak’s Java classes at startup.

  3. Add configuration parameters to expose metrics in the Prometheus format, and send traces to Jaeger for storage and retrieval.

Contrary to other setups, this is not using an OpenTelemetry collector, but instead exposes the metrics directly via Prometheus and sends traces directly to Jaeger.

otel runtime view.dio

Accessing OpenTelemetry traces

Grafana and Jaeger can be used to access the traces, and both are deployed by default.

Assuming the command minikube ip returned 192.168.39.39, Grafana is available on http://grafana.192.168.39.39.nip.io, and Jaeger is available on http://jaeger.192.168.39.39.nip.io

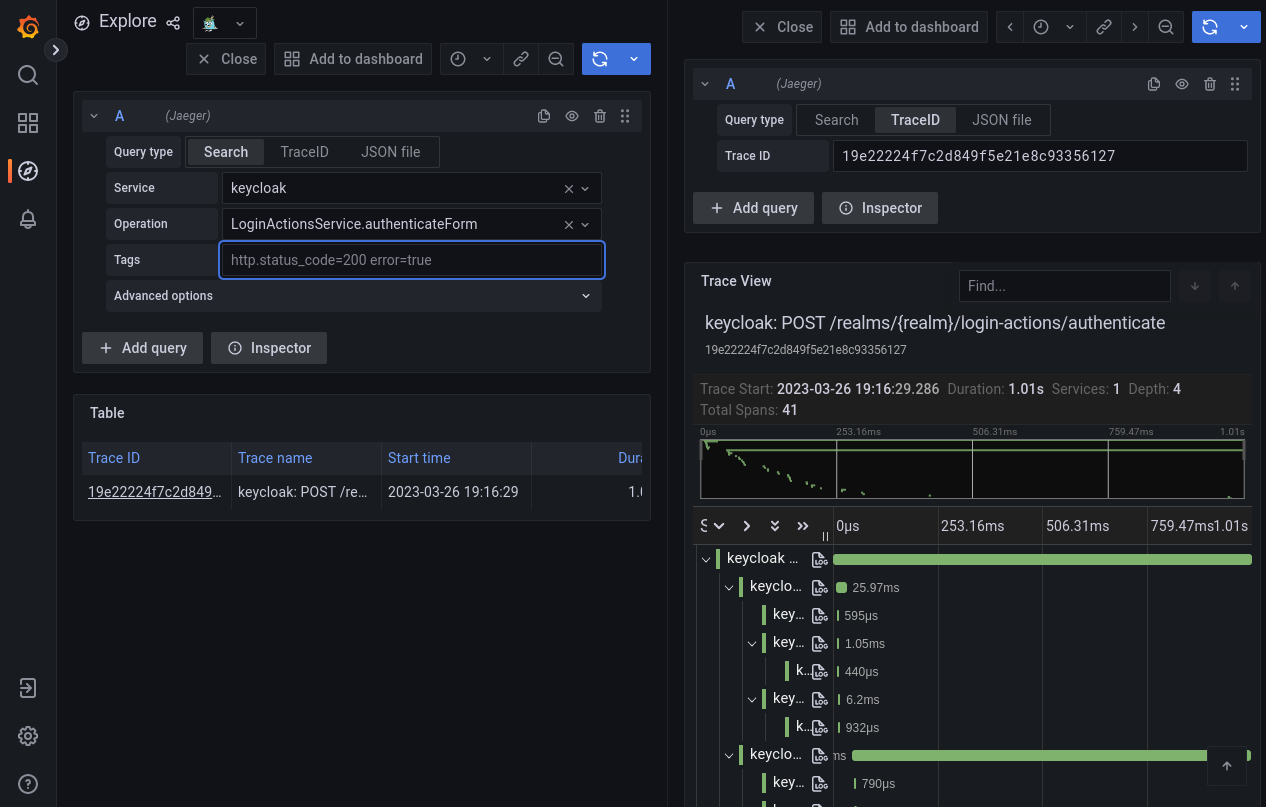
Use the browser to search for traces in Grafana via the Jaeger data source, or use the Jaeger UI directly.

When searching for traces in Grafana, select at least the service keycloak to see traces. The results can be restricted further using the operation and the tags of the trace.

otel grafana search traces

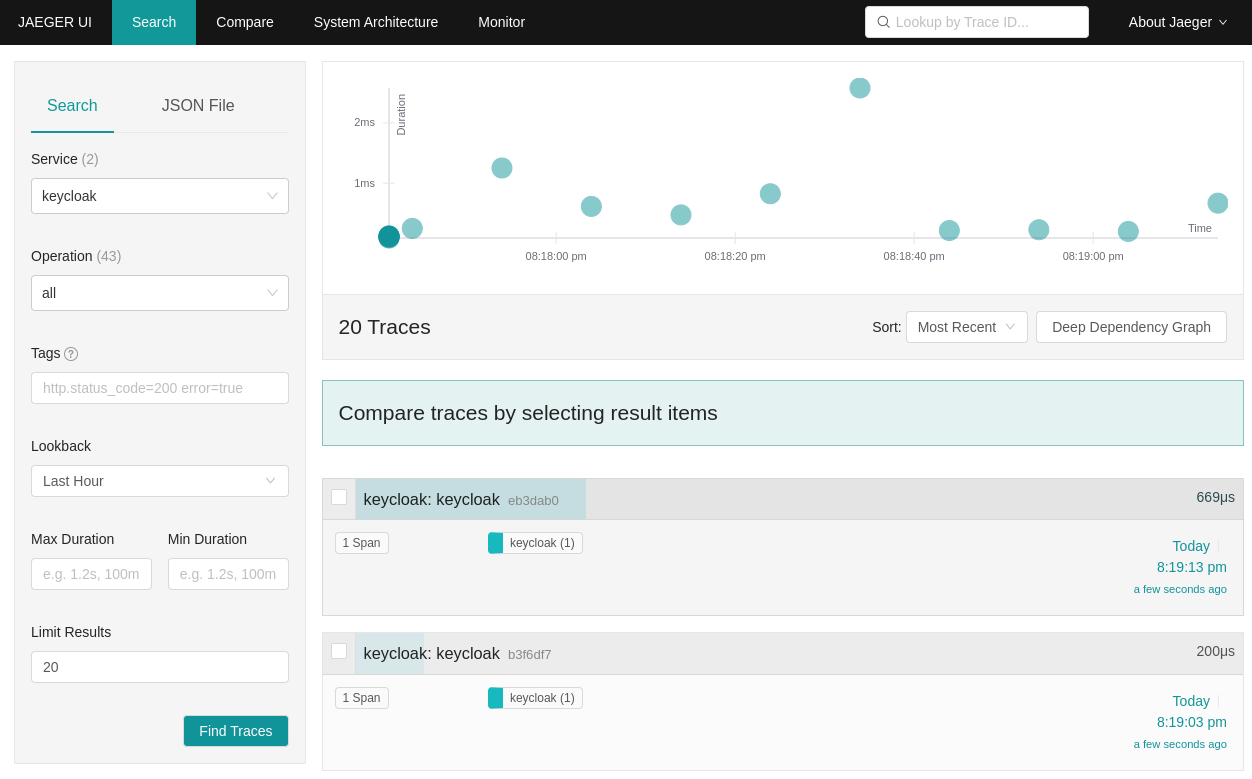
The Jaeger UI is similar. As in the Grafana UI, select the Keycloak service to before searching.

To find out more about the tool, visit the Jaeger homepage.

After running a search in the Jaeger UI, the search timestamp is fixed and encoded in the URL. Therefore, re-running the search or setting different filter options will not find traces which were created after running the first search. To start a search with the latest timestamp, click on Search in the menu toolbar.

otel jaeger search traces

Trace IDs in logs

Once the Java agent is active, it creates trace IDs in all log lines in the MDC (mapped diagnostic context):

... "mdc":{"trace_flags":"01", "trace_id":"72b9fd1ac7229d417655a9c5e240e23b", "span_id":"6612116ac4f97aaa"} …​

When searching for logs in Grafana in Loki, there is a link to the connected trace which will then show on the right.

Please note that this will work only on recorded traces which have a trace_flag logged with 01.

otel from log to trace
Figure 1. Link from logs to traces

Accessing OpenTelemetry metrics

Prometheus scrapes the metrics and stored them in its database. The metrics are then available with the Grafana UI (preferred) or the Prometheus UI.

Use the following query to filter for metrics reported by OpenTelemetry:

{job='keycloak/keycloak-otel'}

There are some additional metrics recorded via OpenTelemetry which are not available from the regular Keycloak metrics endpoint:

http_server_duration_seconds_bucket

For each URL, HTTP method and return code, it records buckets by duration. Use this information to identify latency percentiles for URLs, and find URLs which return error codes.

http_server_duration_seconds_bucket{otel_scope_name="io.opentelemetry.netty-4.1",otel_scope_version="1.27.0-alpha",http_request_method="GET",http_response_status_code="200",http_route="/health/live",network_protocol_name="http",network_protocol_version="1.1",server_address="10.130.4.106",server_port="8443",url_scheme="https",le="0.01"} 2.0

worker_pool_queue_delay_bucket

Delay for executions in the worker pool, bucketed by the delay so tail latencies are available.

worker_pool_queue_delay_bucket{container="keycloak", endpoint="otel-prometheus", instance="172.17.0.8:9464", job="keycloak/keycloak-otel", le="10000.0", namespace="keycloak", otel_scope_name="io.opentelemetry.micrometer-1.5", pod="keycloak-0", pool_name="vert.x-worker-thread", pool_type="worker"} 781

worker_pool_queue_size

Current queue for the worker pool.

worker_pool_queue_size{container="keycloak", endpoint="otel-prometheus", instance="172.17.0.8:9464", job="keycloak/keycloak-otel", namespace="keycloak", otel_scope_name="io.opentelemetry.micrometer-1.5", pod="keycloak-0", pool_name="vert.x-internal-blocking", pool_type="worker"} 0