Collecting metrics via Prometheus
Prometheus collects metrics from services.
|
This only applies to the load testing setup described in Keylcoak Benchmark, see the Metrics section in the Observability Guide. |
About Prometheus
Prometheus collects metrics from services and the Kubernetes platform and provides them to Grafana.
Visit the Prometheus website for more information.
Opening Prometheus
Prometheus is deployed by default.
Assuming the command minikube ip returned 192.168.39.39, the console is available on http://prometheus.192.168.39.39.nip.io.
| minikube’s IP address changes every time the minikube instance is re-created. |
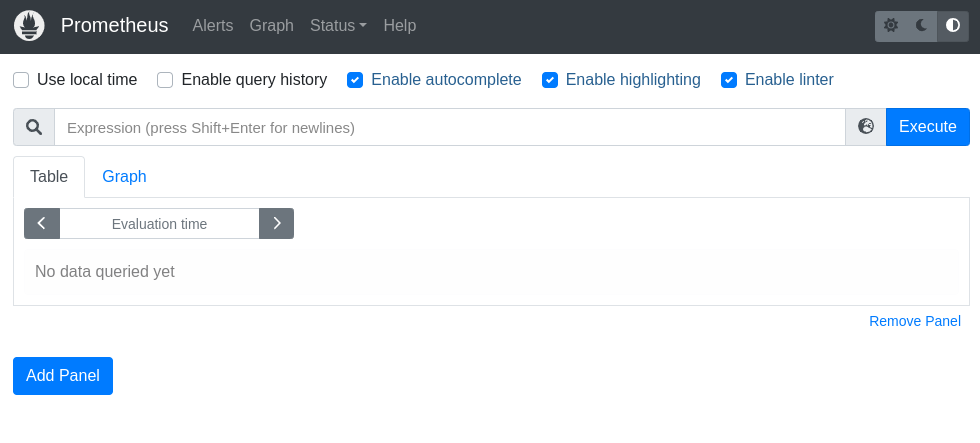
Running custom queries
Enter an expression in search field and press Execute to run the query. Auto-completion is available. See the PromQL docs on how to run queries.
{job='keycloak/keycloak-metrics'}
jvm_memory_used_bytes{job='keycloak/keycloak-metrics'}
To show a minimal graph, switch to the Graph tab.
|
While this is good for ad hoc queries, use Grafana for advanced dashboards which can be persisted. |